
Model Performance Evaluation
To understand how we assess model performance quality we need to introduce to you the metrics True Positive Rate (TPR) and the False Positive Rate (FPR). To explain them, we start by detailing all the possible outcomes of a prediction.
Every time we receive a data point, it is assessed by an array of machine learning models. Each model is responsible for detecting faults in one specific vehicle component and can have two possible outputs: Normal or Faulty. This leads to four different combinations of the actual component state and predicted state:
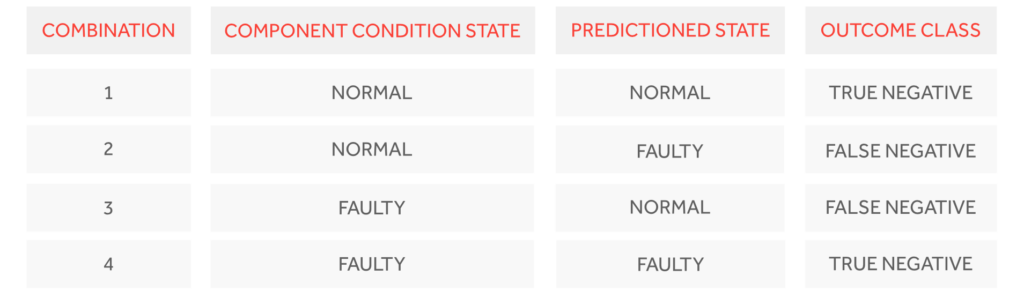
Below, we will explain to you the 4 possible outcome classes in the context of a vehicle failure:
True Negatives (TN): It corresponds to when a vehicle is normal and the algorithm does not trigger an action (as no action is required).
False Positives (FP): When a vehicle is normal but the algorithm warns of failure. This causes trouble and in the end makes the customer lose trust, including in any positive predictions.
False Negative (FN): When a vehicle is failing and the algorithm does not warn. This is a missed opportunity to act on the issue beforehand.
True Positives (TP): When a vehicle is failing and the algorithm warns of failure.
We use the above-mentioned outcome classes to define the two performance metrics accordingly:
False Positive Rate (FPR) = FP/(TN+FP) Is defined as the ratio between all false warnings and the sum of the total number of normal samples. It is essential to keep this metric low to keep healthy vehicles on the road and not in the workshops.
True Positive Rate (TPR) = TP/(TP+FN) Is defined as the ratio between all correct warnings and the sum of all faulty samples. Keeping this high is key to catch as many failing vehicles and at the same time keeping false positives to an absolute minimum.
Note that the better the model, the better is the trade-off point between true positives and false positives.
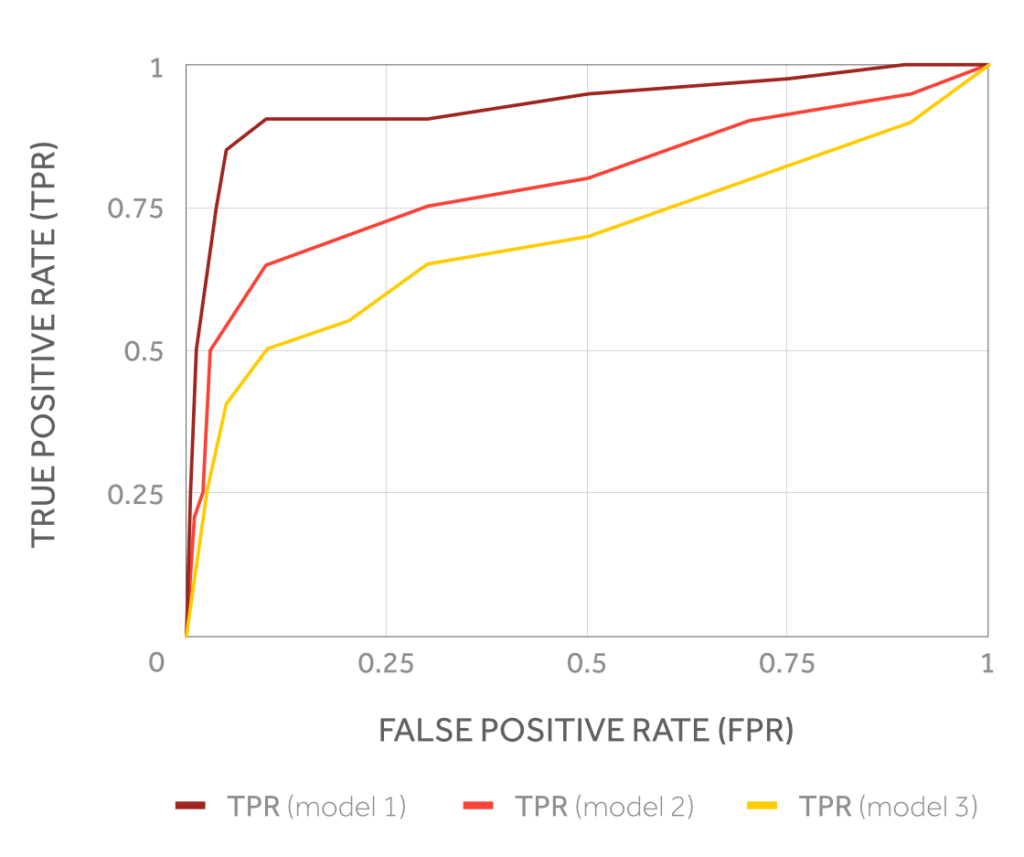
Receiver Operating Characteristics (ROC) curves for three models predicting the same component failure.
Example of Consequences of False Positives
Assuming that 5% of the vehicles experience a common failure during 1 year
- This means that 50 vehicles will experience this failure during the same year
- Representing that 4 vehicles per month will experience this failure
And assuming 1% of False Positives in a sample of 1000 vehicles, and that the Model predicts once every day for 1 week before repair:
- 4 (vehicles per month) x (7 week days) = 28 fault occurrences
- 1000 (vehicles) x 30 (1 month) = 30.000 predictions per month
- With 1% False Positives: 0.01×30000 = 300 fault predictions
The Total amount of predictions is:
-
-
- 28 correct predictions of failure (True Positives)
- 300 false warnings (False Positives)
- 29672 confirmed no problems= (True Negatives)
- The Client will experience (28+300)/30 = 11 daily warnings of the problem
- 10 are false warnings and 1 is a correct warning.
-
This corresponds to a Precision metric of TP/(TP+FP) of: 1/(10+1) = ~ 9%, and it would not be acceptable by fleet operators under any circumstances.
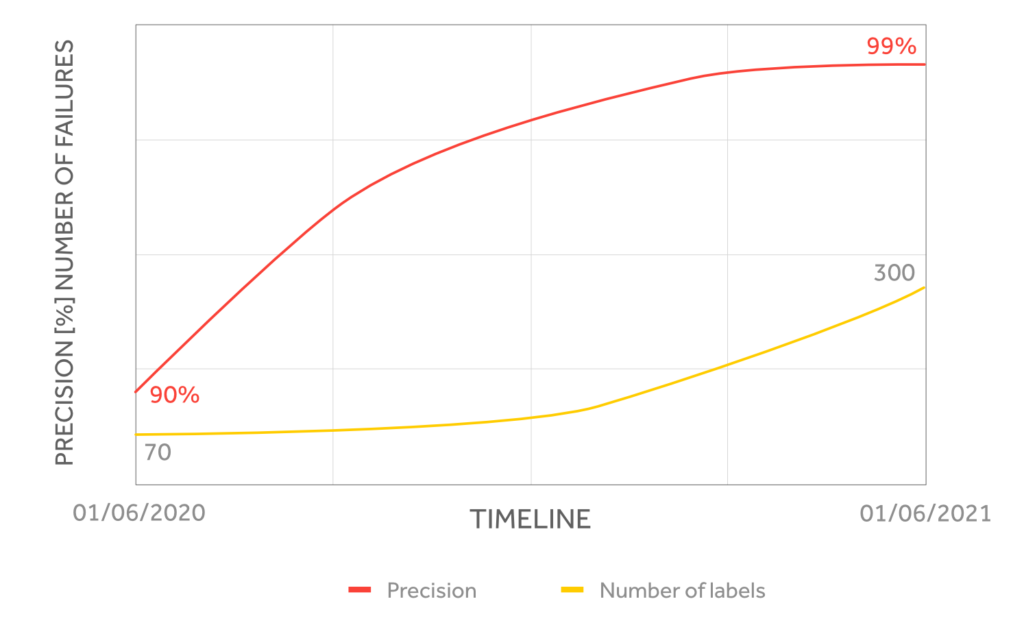
Our models have at least 90% precision, meaning that only 1 out of 10 failure predictions are wrong.
We aim at always working under higher rates of True Positives due to its impact on ensuring operations run smoothly, and for that, we count on an increasing number of Labels to improve the model’s precision.
How Models Improve
There are three major topics that we address when developing a prediction model, out of which two the customer have a direct impact on Repair Logs, Rate Predictions and Vehicle Log Data.
1. Repair Logs
We use vehicle repair logs to learn the relationship between vehicle data patterns and upcoming failures. By getting new failure reports, we can learn new patterns or reinforce already known data patterns.
Our collection of failure reports is used to develop and enhance prediction models. These models are general and can be applied to new customers which we do not have repair log data from, while for the customers that supply repair logs, we automatically create derivative models made for the specifics of each operation. These Models learn and integrate the small and unique differences in each operation.
2. Rate Predictors
The world we live in is not a static place. There are underlying trends that affect everything around us. I.e. a traffic congestion increase will cause new driving patterns, weather conditions vary from year to year and place to place, and so on.
This means that the assumptions made by models at the point of training do not hold for all time and in the end, if not re-trained, model outputs will deteriorate over time. To account for this, we continuously monitor the performance of the models and also offer the possibility to rate individually each prediction they generate.
3. Vehicle Log Data
The third component which needs to be in place is the vehicle data. If you access all the necessary inputs and provide the most accurate and complete outputs, you will achieve more detections and predictions.
Optimization Strategy
We keep the Precision at the highest standard and we optimize for it. Precision is key for all users to build confidence and trust in the system, which in turn drive complete adoption.
Our models are continuously re-trained using the customer data feedback loop. The recall will gradually improve and the precision will remain as more failure reports are used for modelling. To summarize:
• Precision must always be very good, at the cost of the recall. Confidence in the system drives adoption, which in turn drives the economic benefits customers pursue;
• Really good Precision must be maintained while continuously improving the minimum True Positive Rate (recall);
• More repair logs and prediction feedback accelerate the improvement of the minimum True Positive Rate (recall).
- Data-first strategy lowers cost per mile for bus operators - June 19, 2024
- SBS Transit Rolls Out Predictive Maintenancefor its Entire Bus Fleet Including Electric Buses - March 22, 2024
- News: Stratio and GreenRoad Announce Partnership - November 14, 2023